Please note: It can take up to two weeks from when you successfully registered your smart meter for your data to appear. If there is an issue beyond this time frame, please contact us by tapping on this link: Contact Loop support
- Year view:
Shows the total usage per month for the current year. If you want to see previous annual usage, just tap on the previous time frame button to explore (number 7) - Month view:
This is the only view where your historical usage is displayed in a calendar format. Just tap on any day you're interested in, and you'll see the cost and kWh usage for that day - Week view:
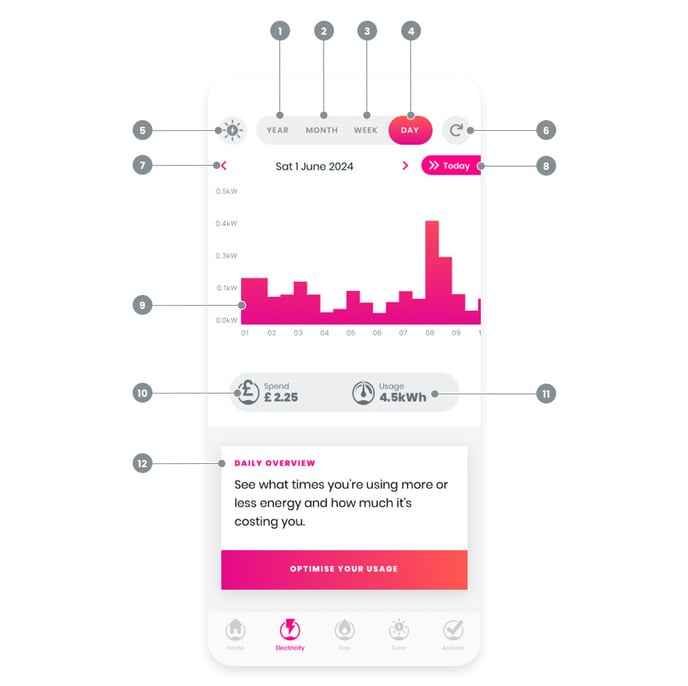
Shows the total usage per week for the current month. If you want to see previous weekly usage, just tap on the previous time frame button to explore (number 7) - Day view:
This shows your current usage. Note that in the background, we are checking for data every three hours to grab anything that is available. - Solar simulation tool:
If we have more than 90 days of data, then the solar simulation tool will be available to you. For more information regarding this tool, tap on this link: Loop Solar and Battery Simulation - FAQs - Screen refresh:
To ensure that your Loop app is displaying the most recent data available, tap on this circular arrow to refresh your data - View previous timeframe:
To display a previous time frame, tap on this button - View today's data:
If viewing a previous time frame and you would like to skip to your most recent data, tap on this link - Graph:
You can either view the total usage or view a single time frame within the graph by tapping on a bar on the graph.
- Note: When you see kWh on your Loop day view, it's a measurement of your electric appliances' wattage and the amount of time you use them.
The difference between kWh and kW, and what you see on your Loop Day view, is that kW reflects the rate of electricity you use, and kWh indicates the amount of electricity you use. On the y axis of the Day view graph, it is labelled kW.
- Note: When you see kWh on your Loop day view, it's a measurement of your electric appliances' wattage and the amount of time you use them.
- Cost view:
Displays the total cost of your usage for your display view. Note that the cost includes your standing charge including your day view but to ensure that this is accurate, please edit your tariff to relect your current rates.
- To view more information on how to edit your tariff, tap on this link: Where can I edit my tariff?
- To view more information regarding your spend value, tap on this link: How are the energy costs shown in the app calculated?
- Usage in kWh
- Daily overview